Fibonacci Buy /Sell SignalsHere is a Fibonacci-based Buy/Sell Indicator using retracement levels for potential support and resistance zones. This indicator plots Fibonacci levels and provides buy/sell signals based on price interaction with these levels.
Fibonacci Levels:
Highest high and lowest low over the lookback period.
Key levels: 38.2% (retracement), 50% (midpoint), 61.8% (strong retracement).
Buy Signal: When the price crosses above the 61.8% Fibonacci level (bullish).
Sell Signal: When the price crosses below the 38.2% Fibonacci level (bearish).
Cerca negli script per "Buy sell"

SMA, VWAP with Buy/Sell Signals - First Signal OnlyIndicator: SMA, VWAP with First Buy/Sell Signals
Overview:
This indicator plots two Simple Moving Averages (SMA 20 and SMA 200) and the Volume-Weighted Average Price (VWAP) on the chart, with fully customizable colors and line thickness. Additionally, it provides buy and sell signals based on the price action relative to these indicators.
Buy Signal:
A buy signal is generated when a green candle (bullish candle) closes above the SMA 20, SMA 200, and VWAP without touching them (i.e., the low of the candle is above all three). This signal will only be plotted for the first such candle of the day to avoid signal clutter.
Sell Signal:
A sell signal is generated when a candle closes below the SMA 20, SMA 200, and VWAP without touching them (i.e., the high of the candle is below all three). Similar to the buy signal, it will only be plotted for the first qualifying candle of the day.
Customization:
SMAs and VWAP: Users can adjust the lengths, colors, and line thickness of the SMAs and VWAP to suit their preferences.
Signal Shape: You can choose from different shapes (arrow, circle, or cross) to represent the buy and sell signals on the chart.
Key Features:
First Candle Only: Both buy and sell signals are generated only for the first candle that satisfies the conditions, ensuring clean and actionable signals.
Visual Customization: Full control over the appearance of the indicator, including signal shapes and line properties.
Works Across Assets: This indicator is applicable to any asset (stocks, forex, crypto) where price action relative to moving averages and VWAP is important.

BRT Signals Buy / Sell v2Title: BRT Signals Buy/Sell v2
Description:
The BRT Signals Buy/Sell v2 script is an innovative and original trading indicator designed to generate precise buy and sell signals by uniquely combining several advanced technical analysis tools. This script introduces new methodologies not found in existing public scripts, offering traders enhanced accuracy and customization.
Key Original Features:
Proprietary Mean Reversion Channel (MRC) Oscillator:
Unlike traditional oscillators, our MRC oscillator is developed using a customized SuperSmoother function, transforming the mean reversion concept into a dynamic oscillator ranging from 0 to 100.
This unique approach allows for more responsive detection of overbought and oversold conditions, setting it apart from standard oscillators.
Advanced Moving Average Options with Jurik Moving Average (JMA):
Incorporates the Jurik Moving Average (JMA), an advanced MA that offers low lag and high smoothness, which is rarely included in public scripts due to its complexity.
Provides multiple MA types (EMA, SMA, RMA, VWMA, WMA, Wilders MA, JMA) for unparalleled customization, enabling traders to fine-tune the indicator to their specific strategies.
Enhanced ADX Trend Strength Filter:
Integrates a custom implementation of the Average Directional Index (ADX) with proprietary modifications to measure trend strength more accurately.
Our script's ADX filter reduces lag and improves the detection of strong trends, a feature not commonly available in other indicators.
Dual Signal Sensitivity Filters:
Introduces two types of signal sensitivity filters (Signal Sensitivity Type 1 and Type 2) that can be independently enabled or disabled.
This dual-filter system is a novel feature that allows for refined control over signal generation, enhancing the script's adaptability.
Sophisticated Labeling and Alert System:
Features a customizable labeling system with various styles and sizes, providing clear and immediate visual cues on the chart.
Includes meticulously configured alert conditions that work seamlessly with the script's unique logic, ensuring timely notifications.
How It Works:
Buy Signal:
Generated when the proprietary MRC oscillator value increases compared to its previous value, indicating upward momentum detected by our unique algorithm.
Price is above the selected moving average (if the EMA filter is enabled), confirming a bullish trend with enhanced precision due to the advanced MA options.
ADX conditions are met using our improved calculation method, ensuring signals occur only during strong uptrends.
Sell Signal:
Triggered when the MRC oscillator value decreases compared to its previous value, signaling downward momentum identified by our custom oscillator.
Price is below the selected moving average (if the EMA filter is enabled), confirming a bearish trend with greater accuracy.
ADX conditions are met, indicating strong downtrends, thanks to our proprietary enhancements to the ADX indicator.
Original Concepts and Calculations:
Customized SuperSmoother Filter: Our version of the SuperSmoother filter is tailored to work specifically with the MRC oscillator, providing smoother and more responsive signals than standard implementations.
Proprietary ADX Enhancements: We have modified the traditional ADX formula to better capture trend strength and direction, reducing lag and improving reliability in various market conditions.
Integration of Advanced Indicators: The script uniquely combines advanced indicators like JMA and our custom MRC oscillator, offering functionalities not found in other public scripts.
Usage Instructions:
Parameter Configuration:
Lookback Period: Adjusts the sensitivity of the Mean Reversion Channel to suit different market conditions.
Timeframe Selection: Analyze different timeframes independent of the chart's timeframe for multi-timeframe analysis.
MA Length and Type: Choose from various moving averages, including the advanced JMA, to align with your trading preferences.
Signal Sensitivity Filters: Enable or disable the EMA and ADX filters to refine signal accuracy based on your strategy.
Visual Aids and Alerts:
Customize label styles and sizes for optimal visualization on the chart.
Set up alerts using the built-in alert conditions to receive real-time notifications aligned with the script's unique logic.
Benefits of Originality:
Enhanced Signal Accuracy: The unique combination of advanced indicators and proprietary calculations reduces false signals, improving the quality of trading decisions.
High Adaptability: The script's extensive customization options allow it to be adapted to various assets, timeframes, and trading styles, making it suitable for a wide range of traders.
Unique Analytical Approach: By introducing new methodologies and integrating advanced technical tools in a novel way, this script provides traders with insights not available in other indicators.
Disclaimer:
This indicator is a unique tool developed to assist traders in making informed decisions. It should be used in conjunction with other analysis methods and does not guarantee profitable results. Always practice proper risk management and due diligence.
Auto Signal Buy/SellAuto Signal Buy/Sell with Time Filter and Dynamic ZLEMA (GMT+2) 🌟
Are you looking for an indicator that combines efficiency and simplicity while integrating advanced elements like SuperTrend, ZLEMA (Zero Lag EMA), and a MACD DEMA for clear and precise buy/sell signals? 📈 Introducing Auto Signal Buy/Sell, the ultimate indicator designed for intraday and swing traders, optimized for market hours in GMT+2.
🛠️ Key Features:
- **Advanced SuperTrend**: Follow the dominant trend with a robust SuperTrend, adjustable to your preferences (customizable multiplier and period).
- **Dynamic ZLEMA**: Get a zero-lag EMA curve with a visual signal. Additionally, the ZLEMA turns blue when it’s nearly flat, helping you easily spot market consolidation phases.
- **MACD DEMA**: An enhanced version of the traditional MACD, using the Double EMA to capture more responsive buy/sell cross signals. 📊
- **Buy/Sell Signals**: Visual arrows clearly indicate potential entry and exit points on your chart, filtered by MACD crossovers and the SuperTrend trend.
- **Smart Time Filter (GMT+2)**: This script adapts to trading hours (customizable) and only displays signals during trading hours. The background turns light blue when the market is closed, preventing confusion during inactivity periods. 🕒
⚙️ Full Customization:
- Adjustable trading hours (default 9 AM to 5 PM in GMT+2) with dynamic background indicating when markets are closed.
- Flexible settings for SuperTrend, ZLEMA, and MACD DEMA to suit any strategy.
🎯 Why Choose This Indicator?
- Optimized for maximum precision with advanced algorithms like ZLEMA and DEMA.
- Easy to use: it provides clear, visual signals directly on the chart—no need to decipher complex indicators.
- A complete intraday and swing indicator that combines trend analysis and signal filtering with precise market hours.
🚀 Boost Your Trading!
Add this indicator to your toolkit and enhance your decision-making. Thanks to its intuitive interface and clear visual signals, you can trade with confidence. 💡
Don't forget to like 👍 and comment if you find this indicator useful! Your feedback helps us continue improving such tools. 🚀
📌 How to Use:
1. Add the indicator to your chart.
2. Adjust the SuperTrend and ZLEMA settings to suit your needs.
3. Follow the buy/sell signals and watch for the light blue background outside of trading hours.
4. Trade effectively and stay in control, even during consolidation phases.

EMA14 Second Time BUY/SELL AlertsEMA14 Crossover Strategy with Conditional BUY/SELL Alerts
This powerful script provides dynamic BUY and SELL alerts based on the interaction between price action and the EMA14 (Exponential Moving Average 14). Ideal for traders looking to capitalize on trend reversals and breakout patterns, this indicator helps you time entries and exits with precision.
Key Features:
Second-Time Crossover Alerts: The script tracks when the price crosses the EMA14 for the second time. This adds confirmation to price movements and helps filter out false signals.
Conditional BUY/SELL Alerts:
BUY Alert: Triggered when the price closes above the EMA14 after a previous SELL signal, indicating a potential trend reversal or breakout to the upside.
SELL Alert: Triggered when the price closes below the EMA14 after a previous BUY signal, signaling a possible shift to the downside.
Advanced Crossover Tracking:
The script counts each crossover of the price relative to the EMA14, generating a BUY or SELL signal on the second instance to provide additional confirmation of trend strength.
Visual Alerts: Labels are plotted directly on the chart to highlight when a BUY or SELL signal has occurred, providing immediate visual feedback for traders to react in real-time.
How It Works:
The script combines the simplicity of EMA14 with enhanced logic that tracks both crossovers and closes relative to the moving average. This ensures that the signals are based not only on quick movements but also on price confirmation, reducing noise and false breakouts.
This script is perfect for traders who rely on moving average strategies and want additional filtering to confirm trends and optimize trade timing.

Bollinger Bands with RSI Buy/Sell Signals (15 min) Bollinger Bands with RSI Buy/Sell Signals (15 Min)
Description:
The Bollinger Bands with RSI Buy/Sell Signals (15 Min) indicator is designed to help traders identify potential reversal points in the market using two popular technical indicators: Bollinger Bands and the Relative Strength Index (RSI).
How It Works:
Bollinger Bands:
Bollinger Bands consist of an upper band, lower band, and a middle line (Simple Moving Average). These bands adapt to market volatility, expanding during high volatility and contracting during low volatility.
This indicator monitors the 15-minute Bollinger Bands. If the price moves completely outside the bands, it signals that the market is potentially overextended.
Relative Strength Index (RSI):
RSI is a momentum indicator that measures the strength of price movements. RSI readings above 70 indicate an overbought condition, while readings below 30 suggest an oversold condition.
This indicator uses the RSI on the 15-minute time frame to further confirm overbought and oversold conditions.
Buy/Sell Signal Generation:
Buy Signal:
A buy signal is triggered when the market price crosses above the lower Bollinger Band on the 15-minute time frame, indicating that the market may be oversold.
Additionally, the RSI must be below 30, confirming an oversold condition.
A "Buy" label appears below the price when this condition is met.
Sell Signal:
A sell signal is triggered when the market price crosses below the upper Bollinger Band on the 15-minute time frame, indicating that the market may be overbought.
The RSI must be above 70, confirming an overbought condition.
A "Sell" label appears above the price when this condition is met.

AI Big Players Move Pattern with Buy/Sell Signals.Big Players Move Pattern with Buy/Sell Signals
Description:
The "Big Players Move Pattern with Buy/Sell Signals" indicator is a powerful tool designed to help traders identify potential market movements driven by institutional investors, also known as big players or smart money. This indicator leverages key patterns such as volume spikes, support and resistance breakouts, and accumulation/distribution trends to generate actionable buy and sell signals.
Key Features:
Volume Spike Detection:
Volume Spike Length: The indicator calculates the moving average of volume over a user-defined period (default: 20 periods).
Volume Spike Multiplier: A volume spike is detected when the current volume exceeds the moving average volume by a specified multiplier (default: 2.0).
Visual Cue: Volume spikes are plotted on the chart with an orange triangle, indicating potential big player activity.
Support and Resistance Breakouts:
Support/Resistance Length: The indicator identifies key support and resistance levels based on the highest highs and lowest lows over a user-defined period (default: 50 periods).
Breakout Detection: The indicator detects and highlights breakouts above resistance levels and breakdowns below support levels.
Visual Cues: Breakouts are plotted with green upward labels, while breakdowns are plotted with red downward labels.
Accumulation/Distribution Line:
Trend Analysis: The accumulation/distribution line is calculated to provide insights into whether a stock is being accumulated (bought) or distributed (sold) by big players.
Visual Cue: The line is plotted on the chart, helping traders understand underlying market trends.
Buy and Sell Signals:
Buy Signal: Generated when a volume spike coincides with a price crossover above the support level.
Sell Signal: Generated when a volume spike coincides with a price crossover below the resistance level.
Visual Cues: Buy signals are plotted with green labels, and sell signals are plotted with red labels.
Alerts:
Custom Alerts: The indicator includes customizable alerts for volume spikes, buy signals, and sell signals, ensuring that traders never miss a significant market movement.
Benefits:
Early Detection: By identifying the activities of big players, traders can position themselves early to capitalize on significant price movements.
Visual Clarity: Clear visual indicators and signals help traders make informed decisions quickly and accurately.
Customization: Adjustable parameters allow traders to tailor the indicator to their specific trading strategies and timeframes.
Use Cases:
Day Trading: Ideal for identifying intraday movements and capitalizing on short-term opportunities.
Swing Trading: Effective for capturing medium-term trends driven by institutional activities.
Position Trading: Useful for understanding long-term accumulation and distribution patterns by big players.
Enhance your trading strategy with the "Big Players Move Pattern with Buy/Sell Signals" indicator and gain a competitive edge by tracking the movements of institutional investors.

Keltner Channel+EMA with Buy/Sell SignalsIndicator Name: Double Keltner Channel with EMA (Buy/Sell Signals)
Description:
This indicator is designed to help traders identify potential trend reversals and generate buy/sell signals in volatile markets. It combines two Keltner Channels with different sensitivities (multipliers of 2.6 and 3.8) to visualize dynamic support and resistance levels. The addition of a 20-period EMA helps confirm trend direction and filter out potential false signals.
How the Indicator Works:
• Keltner Channels: These bands dynamically adjust to changing market volatility, offering a visual representation of potential price ranges. The 2.6 multiplier Keltner Channel (KC) is more sensitive to price changes, potentially highlighting short-term reversals, while the 3.8 multiplier KC focuses on broader trend shifts.
• 20-period EMA: This widely used trend indicator helps smooth out price fluctuations and identify the underlying direction of the market.
• Buy Signals: Generated when a candle's low touches or crosses below either Keltner Channel's lower band, and within the next 6 candles, that same candle closes above the 20 EMA. This combination suggests a potential rejection of lower prices (support) and a possible resumption of the uptrend.
• Sell Signals: Mirror the buy signal logic but are triggered when the candle's high touches or crosses above either Keltner Channel's upper band and then closes below the 20 EMA within the next 6 candles. This indicates a potential rejection of higher prices (resistance) and a possible shift to a downtrend.
How to Use the Indicator:
1. Identify the Trend: Use the 20 EMA to determine the overall trend direction. Look for buy signals primarily in uptrends and sell signals in downtrends.
2. Confirm with RSI : While not included in this indicator, consider using a separate Relative Strength Index (RSI) with a length of 10, SMA type, MA length of 14, and standard deviation of 2. Look for oversold conditions (RSI below 20) to confirm buy signals and overbought conditions (RSI above 80) to confirm sell signals.
3.Apply Risk Management: Always use appropriate risk management techniques, such as stop-loss orders, to protect your capital.
Key Points:
• This indicator is most effective in trending markets.
• It is not a standalone trading system and should be used in conjunction with other analysis tools and confirmation.
• The Keltner Channel multiplier values can be adjusted to suit your trading style and risk tolerance.
Important Disclaimer:
This indicator is a modification of the original Keltner Channel code and is intended for educational and informational purposes only.
It does not constitute financial advice. Always conduct your own research and consult with a qualified financial advisor before making any investment decisions.

Johnny's Adjusted BB Buy/Sell Signal"Johnny's Adjusted BB Buy/Sell Signal" leverages Bollinger Bands and moving averages to provide dynamic buy and sell signals based on market conditions. This indicator is particularly useful for traders looking to identify strategic entry and exit points based on volatility and trend analysis.
How It Works
Bollinger Bands Setup: The indicator calculates Bollinger Bands using a specified length and multiplier. These bands serve to identify potential overbought (upper band) or oversold (lower band) conditions.
Moving Averages: Two moving averages are calculated — a trend moving average (trendMA) and a long-term moving average (longTermMA) — to gauge the market's direction over different time frames.
Market Phase Determination: The script classifies the market into bullish or bearish phases based on the relationship of the closing price to the long-term moving average.
Strong Buy and Sell Signals: Enhanced signals are generated based on how significantly the price deviates from the Bollinger Bands, coupled with the average candle size over a specified lookback period. The signals are adjusted based on whether the market is bullish or bearish:
In bullish markets, a strong buy signal is triggered if the price significantly drops below the lower Bollinger Band. Conversely, a strong sell signal is activated when the price rises well above the upper band.
In bearish markets, these signals are modified to be more conservative, adjusting the thresholds for triggering strong buy and sell signals.
Features:
Flexibility: Users can adjust the length of the Bollinger Bands and moving averages, as well as the multipliers and factors that determine the strength of buy and sell signals, making it highly customizable to different trading styles and market conditions.
Visual Aids: The script vividly plots the Bollinger Bands and moving averages, and signals are visually represented on the chart, allowing traders to quickly assess trading opportunities:
Regular buy and sell signals are indicated by simple shapes below or above price bars.
Strong buy and sell signals are highlighted with distinctive colors and placed prominently to catch the trader's attention.
Background Coloring: The background color changes based on the market phase, providing an immediate visual cue of the market's overall sentiment.
Usage:
This indicator is ideal for traders who rely on technical analysis to guide their trading decisions. By integrating both Bollinger Bands and moving averages, it provides a multi-faceted view of market trends and volatility, making it suitable for identifying potential reversals and continuation patterns. Traders can use this tool to enhance their understanding of market dynamics and refine their trading strategies accordingly.

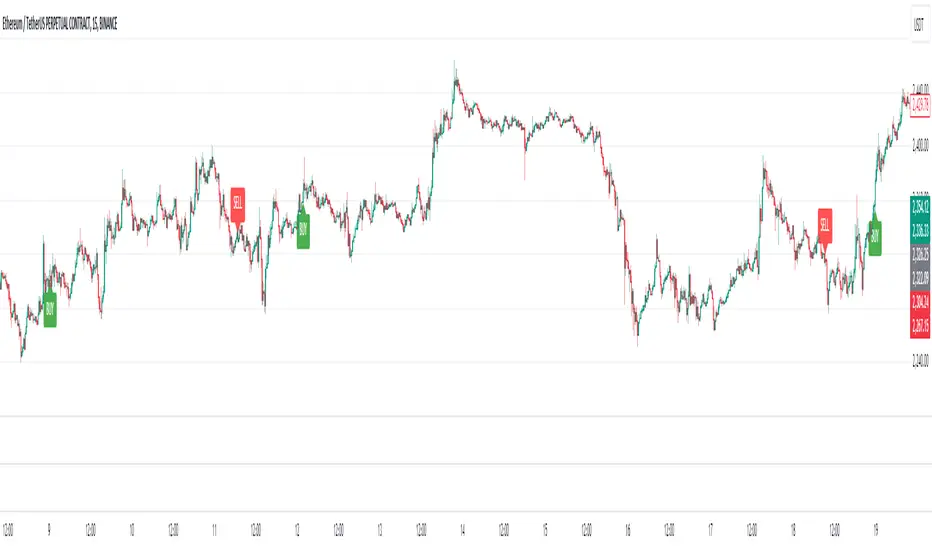
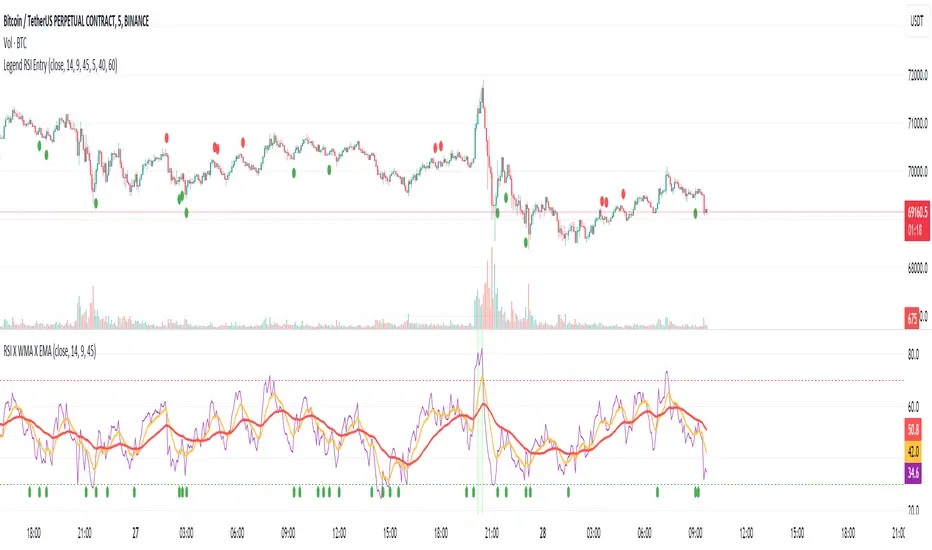
Entry Buy/Sell with Adjustable EMA-WMA Difference by Brian LeThe "Entry Buy/Sell with RSI-WMA Conditions" script, crafted by Brian Le, is a specialized TradingView indicator designed for traders who seek to capitalize on specific RSI (Relative Strength Index) crossover events relative to key moving averages, specifically the EMA (Exponential Moving Average) and WMA (Weighted Moving Average). This tool is particularly useful for identifying potential entry points in a trading strategy, marked by distinctive visual signals on the chart.
Key Features:
Customizable Timeframes and Lengths: Users can adjust the lengths of the RSI, EMA, and WMA, making the indicator versatile across various timeframes and trading styles.
RSI Crossover Signals: The script generates signals based on the RSI crossing over the EMA. A green dot signifies a potential buy signal when the RSI crosses above the EMA, while a red dot indicates a potential sell signal when the RSI crosses below the EMA.
Special Conditions Based on WMA: The indicator enhances decision-making by including the WMA in its analysis. Buy signals (green dots) are only shown when the RSI is below the WMA, and sell signals (red dots) are displayed when the RSI is above the WMA. This additional condition helps in filtering out less probable trades.
EMA and WMA Difference Filter: A unique feature of this script is the ability to set a minimum point difference between the EMA and WMA, adding another layer of specificity to the generated signals.
RSI Threshold Filters: The indicator includes optional filters to show signals only when the RSI is above 40 (for buy signals) or below 60 (for sell signals), aiding in avoiding overbought or oversold conditions.
Enhanced Visuals for Significant Events: For more prominent trading events, such as the RSI crossing both the EMA and WMA within a single candle, the script plots larger symbols (triangles), making these significant events stand out on the chart.
Confluence Buy-Sell Indicator with Fibonacci The script is a "Confluence Indicator with Fibonacci" designed to work on the TradingView platform. This indicator combines multiple technical analysis strategies to generate buy and sell signals based on user-defined confluence criteria. Here's a breakdown of its features:
Confluence Criteria: Users can enable or disable various strategies like MACD, RSI, Bollinger Bands, Divergence, Fibonacci, and Moving Average. The number of strategies that need to align for a signal to be generated can be set by the user.
Strategies Included:
MACD Strategy: Uses the Moving Average Convergence Divergence method to identify buy/sell opportunities.
RSI Strategy: Utilizes the Relative Strength Index to detect overbought or oversold conditions.
Bollinger Bands Strategy: Incorporates Bollinger Bands to identify volatility and potential buy/sell signals.
Divergence Strategy: A basic implementation that detects bullish and bearish divergences using the RSI.
Fibonacci Strategy: Uses Fibonacci retracement levels to determine potential support and resistance levels.
Moving Average Strategy: Employs a crossover system between the 50-period and 200-period simple moving averages.
Additional Features:
Support & Resistance: Identifies major support and resistance levels from the last 50 bars.
Pivot Points: Calculates pivot points to determine potential turning points.
Stop Loss Levels: Automatically calculates and plots stop-loss levels for buy and sell signals.
NYC Midnight Level: Option to display the New York City midnight price level.
Visualization: Plots buy and sell signals on the chart with green and red markers respectively.
Adequate Category:
"Technical Analysis Indicators & Overlays" or "Strategy & Scripting Tools".

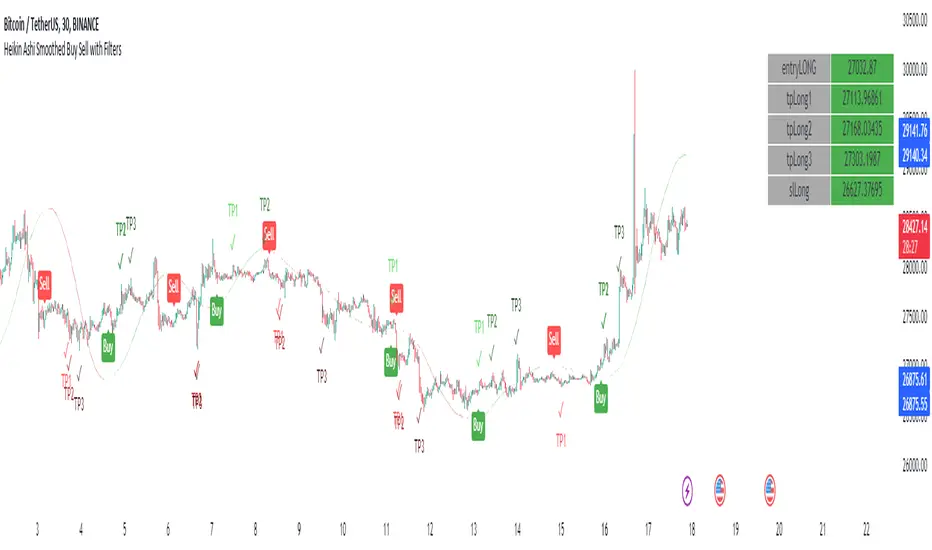
Heikin Ashi Smoothed Buy Sell with FiltersWhat is the Heikin Ashi Smoothed Buy-Sell Indicator?
This Pine Script code defines a complex indicator used to determine buy-sell signals on financial charts. The indicator operates based on the smoothed version of Heikin Ashi and is fortified with various filters.
1. Parameters and Settings:
At the start of the code, there are a series of input parameters for the user to customize the indicator. These parameters include:
Trend Filter: Checks whether it is above or below the long-term moving average.
Momentum Filter: Uses the RSI (Relative Strength Index) indicator to check if the market is overbought or oversold.
Volatility Filter: Evaluates the market's volatility level using the ATR (Average True Range) indicator.
Volume Filters: Uses various volume-related parameters to measure the strength of the trade signal.
Trade Settings: Specifies percentage values for target and stop-loss levels to be used in trading.
Moving Average Settings: Allows you to select which moving average to use and its duration.
2. Heikin Ashi Smoothed Calculations:
Heikin Ashi is a charting method used to more clearly represent price movements. The smoothed Heikin Ashi ensures smoother price movements.
3. Moving Average Calculations:
The indicator contains a function to calculate different types of moving averages. These moving averages are used to determine the market trend.
4. Filters:
This indicator includes a series of filters to enhance the quality of the signal. Filters help reduce false signals and produce more robust trading signals.
5. Buy-Sell Signals:
All these filters and calculations are brought together to determine potential buy and sell signals. Signals are triggered when all the specified conditions are met.
6. Chart Visualizations:
This indicator uses various plotting functions to visualize signals and trend information on the chart. This allows the user to easily see signals and the trend on the chart.
7. Trade Settings:
When buy and sell signals are triggered, this section checks if it has reached the specified targets and stop-loss levels.
8. Alerts:
This indicator also sends alerts to the user when specific conditions are met. This ensures that the user doesn't miss potential trading opportunities.
In conclusion, this Pine Script indicator produces buy-sell signals by analyzing market movements and applying various filters. Based on the smoothed version of Heikin Ashi, this indicator is useful for trend followers and is fortified with various filters, thus enhancing the quality of trading signals.
Heikin Ashi Yumuşatılmış Al-Sat Göstergesi Nedir?
Bu Pine Script kodu, finansal grafiklerde al-sat sinyallerini belirlemek için kullanılan karmaşık bir göstergeyi tanımlar. Gösterge, Heikin Ashi'nin yumuşatılmış sürümünü temel alarak çalışır ve çeşitli filtrelerle güçlendirilmiştir.
1. Parametreler ve Ayarlar:
Kodun başlangıcında, kullanıcının göstergeyi kişiselleştirmesi için bir dizi giriş parametresi bulunmaktadır. Bu parametreler şunları içerir:
Trend Filtresi: Uzun vadeli hareketli ortalamanın üstünde veya altında olup olmadığını kontrol eder.
Momentum Filtresi: RSI (Göreceli Güç Endeksi) göstergesini kullanarak piyasanın aşırı alım veya aşırı satım durumunu kontrol eder.
Oynaklık Filtresi: ATR (Ortalama Gerçek Aralık) göstergesi ile piyasanın oynaklık seviyesini değerlendirir.
Hacim Filtreleri: Ticaret sinyalinin gücünü ölçmek için hacimle ilgili çeşitli parametreleri kullanır.
Ticaret Ayarları: Ticarette kullanılacak hedef ve stop-loss seviyeleri için yüzdelik değerleri belirtir.
Hareketli Ortalama Ayarları: Hangi hareketli ortalamayı kullanacağınızı ve bu ortalamanın süresini seçmenizi sağlar.
2. Heikin Ashi Yumuşatılmış Hesaplamaları:
Heikin Ashi, fiyat hareketlerini daha net bir şekilde göstermek için kullanılan bir grafikleme yöntemidir. Yumuşatılmış Heikin Ashi, fiyat hareketlerinin daha pürüzsüz olmasını sağlar.
3. Hareketli Ortalama Hesaplamaları:
Gösterge, farklı türde hareketli ortalamaları hesaplamak için bir fonksiyon içerir. Bu hareketli ortalamalar, piyasa trendini belirlemek için kullanılır.
4. Filtreler:
Bu gösterge, sinyal kalitesini artırmak için bir dizi filtre içerir. Filtreler, yanlış sinyalleri azaltmaya yardımcı olur ve daha sağlam ticaret sinyalleri üretir.
5. Al-Sat Sinyalleri:
Tüm bu filtreler ve hesaplamalar, potansiyel al ve sat sinyallerini belirlemek için bir araya getirilir. Sinyaller, belirlenen koşulların tümü karşılandığında tetiklenir.
6. Grafik Görselleştirmeleri:
Bu gösterge, sinyalleri ve trend bilgisini grafik üzerinde görselleştirmek için çeşitli çizim fonksiyonları kullanır. Bu, kullanıcının grafik üzerinde kolayca sinyalleri ve trendi görmesini sağlar.
7. Ticaret Ayarları:
Alış ve satış sinyalleri tetiklendiğinde, bu bölüm belirlenen hedeflere ve stop-loss seviyelerine ulaşıp ulaşmadığını kontrol eder.
8. Uyarılar:
Bu gösterge ayrıca, belirli koşullar karşılandığında kullanıcıya uyarı gönderir. Bu, kullanıcının potansiyel ticaret fırsatlarını kaçırmamasını sağlar.
Sonuç olarak, bu Pine Script göstergesi, piyasa hareketlerini analiz ederek ve çeşitli filtreleri uygulayarak al-sat sinyalleri üretir. Heikin Ashi'nin yumuşatılmış sürümüne dayanan bu gösterge, trend takipçileri için kullanışlıdır ve çeşitli filtrelerle güçlendirilmiştir, böylece ticaret sinyallerinin kalitesi artar.
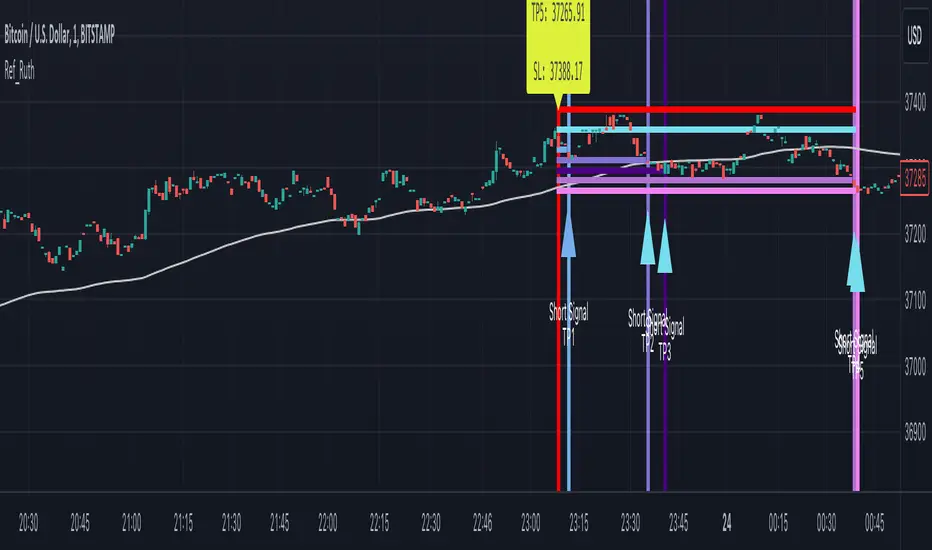
Ruth Buy/Sell Signal for Day Trade and Swing TradeRuth is based on the most known technical indicators and designed for intraday traders. Ruth's aim is to find the best Buy/Sell points and decide to stop loss point with minimum Loss also Ruth tries to find multiple Profit points as TP1/TP2/TP3/TP4/TP5. Ruth was designed based on the heat map colors to be user-friendly and easy to read. While cold color preferred for Short positions, warm colors preferred for Long positions. The most important feature of Ruth is that after the signal is generated, the candles in which the profitable levels are painted one by one with their own special color codes, so that even the most inexperienced users can understand where they should close their positions.
There are two types of signal Ruth can produce for fast trade.
Short Signal: These signals means market tends to be move to down.
Short Stop Loss Point: This is the maximum risk for the position. Shown with single red line inside of the signal.
Short Entry Point: This is the best entry price for short side position. Shown with single baby blue line inside of the signal.
Short Take Profit (TP1): This level represents the profit level the signal is most likely to reach. Shown with single blue line inside of the signal.
Short Take Profit (TP2): This level represents the profit level with a high probability of the signal occurring. Shown with single light purple line inside of the signal.
Short Take Profit (TP3): This level represents the profit level with an intermediate probability of the signal occurring. Shown with single dark purple line inside of the signal.
Short Take Profit (TP4): This level represents the profit level with a low probability of the signal occurring. Shown with single light lilac line inside of the signal.
Short Take Profit (TP5): This level represents the profit level with a tight probability of the signal occurring. Shown with single dark lilac line inside of the signal.
Long Signal: These signals means market tends to be move to up.
Long Stop Loss Point: This is the maximum risk for the position. Shown with single red line inside of the signal.
Long Entry Point: This is the best entry price for short side position. Shown with single baby blue line inside of the signal.
Long Take Profit (TP1): This level represents the profit level the signal is most likely to reach. Shown with single greenish yellow line inside of the signal.
Long Take Profit (TP2): This level represents the profit level with a high probability of the signal occurring. Shown with yellow purple line inside of the signal.
Long Take Profit (TP3): This level represents the profit level with an intermediate probability of the signal occurring. Shown with single dark yellow line inside of the signal.
Long Take Profit (TP4): This level represents the profit level with a low probability of the signal occurring. Shown with single orange line inside of the signal.
Long Take Profit (TP5): This level represents the profit level with a tight probability of the signal occurring. Shown with single dark orange line inside of the signal.
Timeframe: In general best and fastest results occurred in shorter timeframes like 1 min / 5 mins / 15 mins but feel free to try higher timeframes.
Tips & Tricks:
1) Gray line drawn ot the graph represents Dema, we suggests you to go on Short Singals under gray line and go on Long Signals upper gray line.
2) Mostly, Signals easily reach their TP2 / TP3 levels and then generally there is reaction or take profit desire so commodity price turns the opposite direction. If in short time price won't turn to Signal direction close position.
3) Don't forget, every positions has own risks and profits but trade in main trend is crucial.
ROC Based Buy/Sell SignalsIndicator Explanation:
The "Consolidation Identifier (ROC) with Buy/Sell Signals" indicator is designed to help traders identify potential consolidation zones in the market using the Rate of Change (ROC) indicator. It plots both the positive and negative ROC values, providing insights into price momentum changes. The indicator also includes buy and sell signals that are generated when the positive ROC crosses above the negative ROC (buy signal) or when the negative ROC crosses above the positive ROC (sell signal).
How It Works:
The indicator calculates the ROC of the closing price over a specified period. ROC measures the percentage change in price over a given period. Positive ROC values indicate price increases, while negative ROC values indicate price decreases.
The positive and negative ROC values are plotted on the chart using different colors. The key feature of this indicator is the buy and sell signals that occur when the positive ROC crosses above the negative ROC (buy signal) or when the negative ROC crosses above the positive ROC (sell signal). These signals can help traders identify potential shifts in momentum and potential consolidation zones.
Why It's Useful:
Consolidation Detection: The indicator helps identify periods of potential consolidation in the market. Consolidation zones often precede significant price movements, making them valuable for traders looking to anticipate trends.
Momentum Shifts: The ROC crossovers provide insights into momentum changes. Buy and sell signals can indicate shifts in the market sentiment, helping traders make more informed decisions.
Pairs Well With:
Volume Analysis: Combining this indicator with volume analysis can provide a more comprehensive view of market activity during consolidation zones.
Trend Confirmation Indicators: Pairing with trend-following indicators can help confirm the direction of potential breakout moves following consolidations.
Warnings:
False Signals: Like any technical indicator, false signals can occur, especially in choppy or low-volume markets. Always use additional indicators or analysis to confirm signals.
Market Conditions: The effectiveness of the indicator can vary based on market conditions. It may work better during ranging or consolidation periods rather than strong trending phases.
Parameter Optimization: Adjusting the indicator's parameters (ROC period, SMA period, ROC threshold) may be necessary to fine-tune its performance for specific assets or timeframes.

External Indicator Analysis Overlay | Buy/Sell | HTF Heikin-AshiThis chart overlay offers multiple candlestick display options. The Regular (Japanese) and the Heikin-Ashi candles are well known. The Mari-Ashi (or Renko) option is something special as it should be timeframe independent, so that sideways action should be represented in one candle. That is difficult to realize as an overlay on the normal candlestick structure, but perhaps the chosen implementation is useful nonetheless. The Velocity option is experimental and is designed to show if the price has accelerated too much in a trend direction. In this case, the highs and lows do not reflect the actual highs and lows, but indicate the overshooting velocity. The opening of the candle also depends on the inherent velocity, but the close of the candle is always the actual close. Anyway, it doesn't look very useful, but the option is there.
All options can be applied to higher timeframes. A usable setting is obtained by disabling only the body of the TradingView candles in regular mode and enabling this overlay.
A large part of this overlay consists of buy/sell indication settings. For activation it is necessary to select an external source. For example the “Relative Bi-Directional Volatility Range”, specifically the Trend Shift Signal (TSS). This signal switches from 0 to 1, if the trend becomes bullish or from 0 to -1, if the trend becomes bearish. It will be automatically detected without specifying the Indication Type. Alternatively, the Volatility Moving Average (VMA) would meet the requirements for the Indication Type “Buy = positive | Sell = negative”. The Moving Average Convergence Divergence (MACD) also fulfills these conditions. Another example is to use any Moving Average with the Indication Type “Buy = rising | Sell = falling”. In the chart above the Hull Moving Average (HMA) is used. In addition, it is possible to reverse the signal, so that positive signals become negative and vice versa. The signals will be labeled as Buy or Sell on the chart.
The user can analyze whether the provided signals are good or bad indications for going long or short or simply for rebalancing a portfolio. Therefore, it is possible to set a starting point for the analysis and choose a weighting for the investments from 0% to 100% of the portfolio. To avoid sleepless nights, a very reliable (and conservative) setting seems to be Rebalancing with 50% (very similar to the well-known 60/40 portfolio). The calculation results are shown in a table.
As a small addition there is the possibility to label the peaks by setting the distance between the highs/lows. This will make the quality of the buy and sell signals even more clear.

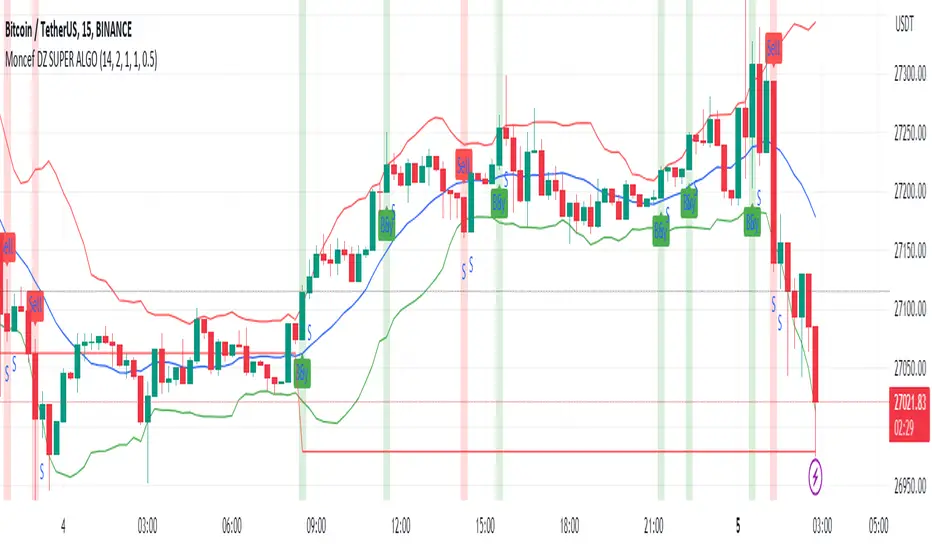
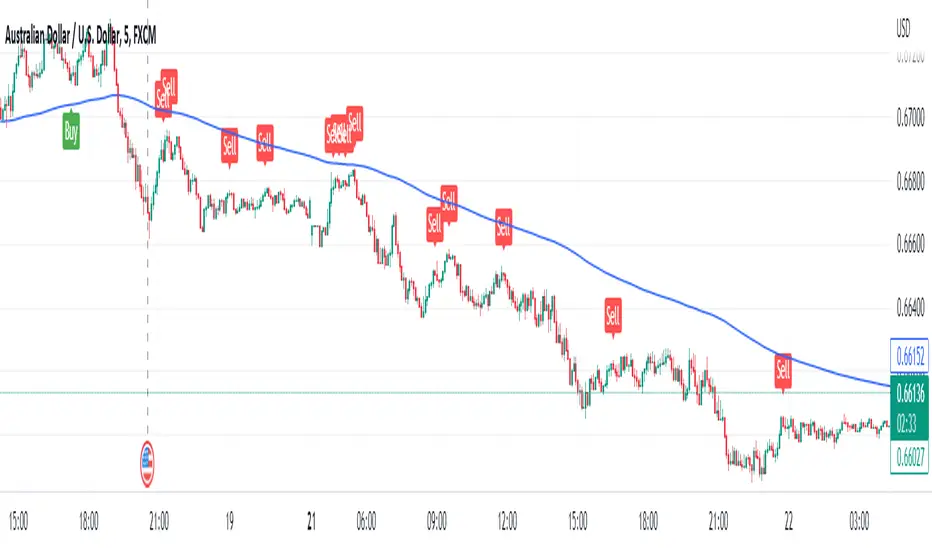
DZ SR Buy&Sell Enhanced StrategyThis ALGERIAN indicator titled "SR Buy&Sell with Enhanced Strategy" is designed to identify support and resistance levels on a financial chart, and generates enhanced buy and sell signals based on these levels. It is based on a trading strategy that uses a combination of moving means and standard deviation to calculate support and resistance levels.
The indicator plots support and resistance levels on the chart, with blue color for base level, red for resistance and green for support. Green arrows are displayed when a buy signal is generated, and red arrows when a sell signal is generated.
The market entry strategy is based on breaking support and resistance levels. When a buy signal is generated and no position is opened, a buy position is opened with a take profit and stop loss level calculated according to the parameters set by the user. Similarly, when a sell signal is generated and no position is opened, a sell position is opened with the corresponding take profit and stop loss levels.
The indicator also displays a “STOP” indicator when a position exit signal is generated, indicating to the trader that it is time to close the current position.
This indicator is a powerful tool for traders who want to exploit support and resistance levels to improve their trading decisions. It can be used in different financial markets and different time periods. Parameters such as average moving length, deviations and multiplier can be adjusted according to individual trader preferences.
Note: This indicator only provides potential signals and does not guarantee positive results with every trade. It is recommended to use this indicator in combination with other technical analysis and risk management tools to make informed decisions when trading.
Most Power V5 Most Power V5
The MOST indicator is an indicator used as a Moving Stoploss. The MOST indicator also generates a buy signal in case the prices rise, unlike the traditional indicators that allow you to make stop losses.In the MOST POWER V5 indicator, stoploss generates its signals using moving averages such as 'SMA', 'EMA', 'WMA', 'VWMA', 'HMA', 'SMMA', 'DEMA' rather than just the current price. In this way, it aims to prevent false signals that may be produced by excessive price movements during the day.
MOST POWER Indicator follows the average by preserving the stop loss distance in the movement of the moving average in the same direction.
The second variable that creates the MOST POWER curve is the stop loss distance that gives power to MOST with the moving average used and the shift rate that provides the stop signal. In this version, this distance is prepared with 2 separate inputs for both buy and sell.You can set these values as "percentage for long trend" and "percentage for short trend" in the indicator input properties.
You can also enter your Take Profit-1, Take Profit-2-, Take Profit-3- and Stop Loss levels in the indicator input properties, especially if you are interested in algo trading or to take advantage of the wonderful alarm setup features of tradingview and get the chance to get maximum profit. (If you enter Take Profit-1, Take Profit-2-, Take Profit-3- and Stop Loss levels as 0. Only buy and sell labels will appear on the indicator.)
Also, activate the amplitude filter option from the indicator input settings to get less signal and filter our inputs.
In addition, the entry price, take profit1, take profit2, take profit3 values for the last transaction opened to make things easier are located in the upper right corner of your graph as a table.
Important note: No indicator guarantees investment. That's why the tests you will do before real trades are very important in this indicator. I wish you all successful trades.
i will show how works with examples
Example 1
If you enter Take Profit-1, Take Profit-2-, Take Profit-3- and Stop Loss levels greater than 0
Example 2
If you enter Take Profit-1, Take Profit-2-, Take Profit-3- and Stop Loss levels as 0 (u will see only buy - sell labels)
Example 3
if select Amplitude Filter is on . you will see less signal
how works Amplitude Filter whats logic ?
if Amplitude Filter is active the signal from mostpower will be combined with Amplitude Filter.
for example, if the amplitude value is 2, the highest price and the lowest price of the last 2 bars are calculated. then this amplitude value is calculated for sma with its source high and low. Based on these values, the trend is determined in the amplitude of the price movement.
Important note: No indicator guarantees investment. That's why the tests you will do before real trades are very important in this indicator. I wish you all successful trades.

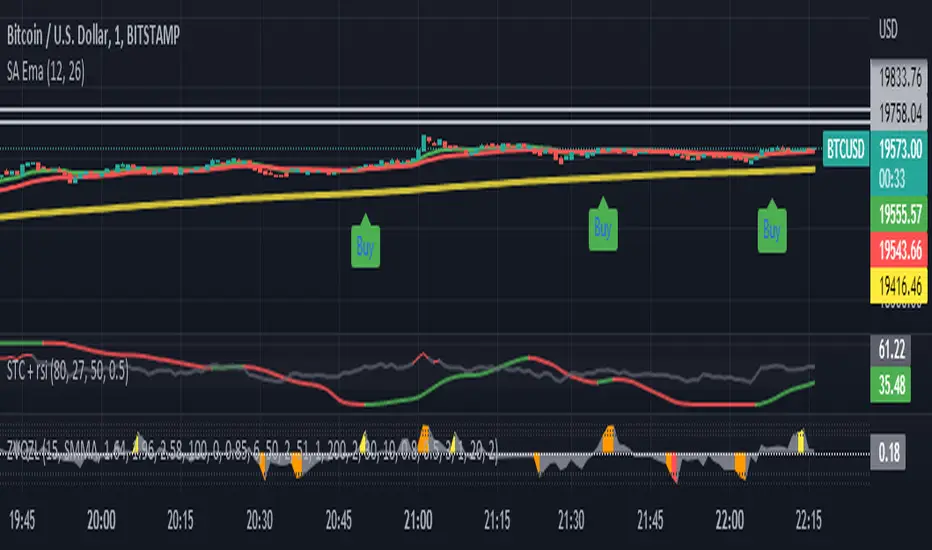
Stochastic Buy Sell with EMA TrendStochastic Buy Sell with EMA Trend is combination of two indicators only.
The Stochastic Oscillator ( STOCH ) is a range bound momentum oscillator. The Stochastic indicator is designed to display the location of the close compared to the high/low range over a user defined number of periods. Typically, the Stochastic Oscillator is used for three things; Identifying overbought and oversold levels, spotting divergences and also identifying bull and bear set ups or signals.
The Exponential Moving Average (EMA) is a specific type of moving average that points towards the importance of the most recent data and information from the market.
1) Stochastic - It is giving signal whenever cross happen in oversold or overbought zone.
2) EMA 200 - EMA 200 is used to identify market trend.
Long :
If stochastic giving buy signal and price is over 200 EMA.
Short :
If stochastic giving sell signal and price is below 200 EMA.
POWER OF STOCK'S 5 EMA BUY / SELL Indicator is based mainly on two conditions :
1. Previous candle should not touch 5 EMA.
2. Current candle should close “ABOVE/BELOW” 5 EMA.
Features -
* Buy candle is represented by Aqua Color
* Sell candle is represented by Fuchsia Color
* You can set Risk: Reward ratio. ( Default = 1:2)
* It also shows label for Entry, Stop Loss & Target.
* Suggested timeframe 15 Minutes for intraday.
* Use closing basis Stop loss.
sohail Anjum EMA buy sellBased on Sohail anjum
Ema crossing teaching
Crossover alerts, only in trend 200 Ema (yellow line) make sure If the price is above the 200 EMA, you can prefer a long position and ignore short positions.
If the price is below the 200 EMA, you are allowed to open only short positions and avoid long positions.
Do not use this indicator alone, Use other recommended indicators by ShohailAnjum Rsi, Macd , chart pattren, etc
This indicator good win rate in 15m TF recommended 1H, 4H
Better DiNapoli Stoch oscillator with buy/sell signals and alertThis version of Joe DiNapoli stochastic oscillator uses only one line for a better overview. Signals are displayed as soon as the line exceeds or falls below the center line. Also the candle color changes with this signal.
Alarms can also be set for these signals.
As long as the current candle is not closed, the line is displayed in yellow.
The following settings can be made:
- Lockback periode for highest high and lowest low
- Smoothing
- Candle Color
- Stochastic line color
This indicator works well with indicators such as EMA or others.
Have fun using it.

MACD + RSI with Trade SignalsThis indicator by default comes with the MACD shown but can be switched to show the RSI instead. Settings for each indicator can also be customized as well as Buy/Sell signals given based on pull back crossovers that follow the 200 EMA of the price Chart. There's an above/below middle fill option you can use but I tend not to but I know some traders like to see when an oscillator is above/below the middle and use it as a trend diretion. By the way, the fourth setting for the MACD (which is 2 by default) is the size of the histogram.
Buy Signal = Price is above the 200 EMA. Current or previous MACD or RSI line is/was below middle line and now crossed above the signal line.
Sell Signal = Price is below the 200 EMA. Current or previous MACD or RSI line is/was above middle line and now crossed below the signal line.
There are alerts for each signal as well (MACD and RSI, both buy and sell).
Feel free to leave a comment regarding issues or suggestions for this indicator or ideas for the next one I should do :)

CHN BUY SELLCHN BUY SELL is formed from two RSI indicators, those are RSI 14 and RSI 7 . I use RSI 14 to determine the trend and RSI 7 to find entry points.
+ Long (BUY) Signal:
- RSI 14 will give a "BUY" signal, then RSI 7 will give entry point to LONG when the candle turns yellow.
+ Short (SELL) Signal:
- RSI 14 will give a "EXIT" signal, then RSI 7 will give entry point to SHORT when the candle turns purple.
+ About Take Profit and Stop Loss:
- With Gold, I usually set Stop Loss and Take Profit at 50 pips
- With currency pairs, I usually keep my Stop Loss and Take Profit at 30 pips
- With crypto, I usually keep Stop Loss and Take Profit at 1.5%
Recommended to use in time frame M15 and above .
This method can be used to trade Forex, Gold and Crypto.
My idea is formed on the view that when the price is moving strongly, the RSI 14 will tell us what the current trend is through a "BUY" or "EXIT" signal. When RSI 14 reaches the oversold area it will form a "BUY" signal and when it reaches the overbought area it will give an "EXIT" signal. I believe that when the price reaches the oversold or overbought area, the price momentum has also decreased and is about to reverse.
After receiving a signal from RSI 14, my job is to wait for an Entry signal from RSI 7. When RSI 7 reaches the overbought area, a yellow candle will appear and that's when we enter a LONG order. When the RSI 7 reaches the oversold area, a purple candle will appear and that's when we enter a SHORT order.
